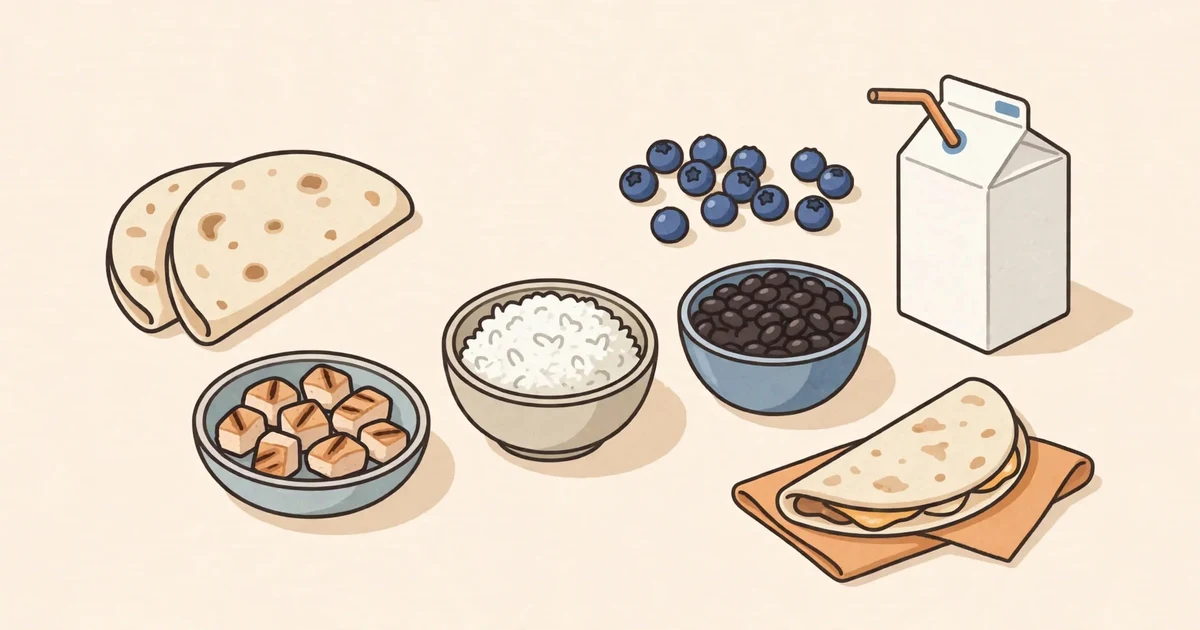
Chipotle Kids Meal Nutrition: Every Option, Checked Against Official Data
The short answer
Two things the data makes clear. First: the kids menu is not a shrunken adult menu — it runs on 34 separate kids-specific entries (2 oz proteins, kids-size tortillas, rice, beans, sides, drinks), not adult values divided in half. Second: the biggest calorie lever in a kids order isn’t the starter you pick, it’s the side — blueberries (20 cal) vs. kids chips (140 cal) swings the meal six times more than the gap between the two starters.
Not a shrunken adult menu
Most nutrition calculators handle kids’ menus by halving adult numbers. This dataset doesn’t: the production data keeps separate kids rows for tortillas, proteins, rice, beans, toppings, sides, and drinks, isolated from adult meal flows. That matters because kids proteins are 2 oz servings against adult 4 oz — a scaled guess would be wrong in both directions.
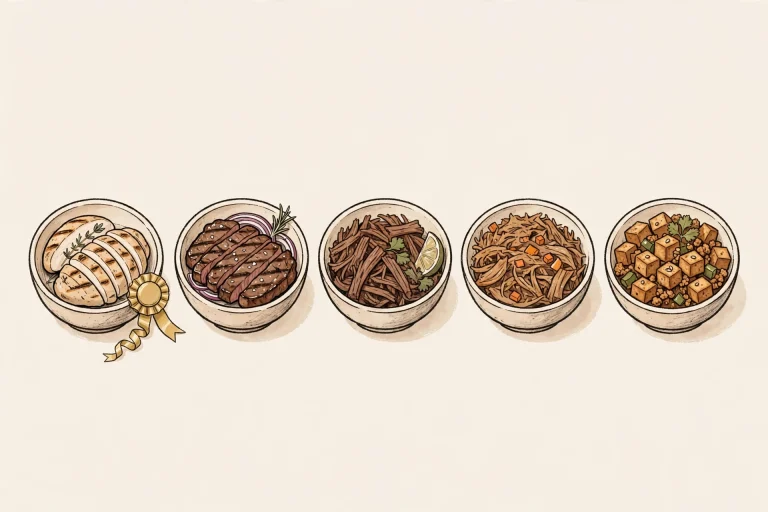
The current kids protein lineup, per serving:
| Kids protein (2 oz) | Calories | Protein |
|---|---|---|
| Kids Chicken | 90 | 15 g |
| Kids Barbacoa | 80 | 12 g |
| Kids Carnitas | 110 | 12 g |
| Kids Steak | 70 | 10 g |
| Kids Sofritas | 70 | 4 g |
| Kids Fajita Veggies | 20 | 1 g |
| Kids Pollo Asado (limited time) | 90 | — |
Chicken lists the most protein per serving at 15 g; steak and sofritas list the fewest calories at 70. (Dataset observations, not recommendations.) Note the last row: Kids Pollo Asado’s macros beyond calories are currently unavailable — shown as unavailable, not guessed. That’s the site’s missing-values policy working in public.
Two starters, structurally different
The kids menu has two starters, and they don’t begin from the same place:
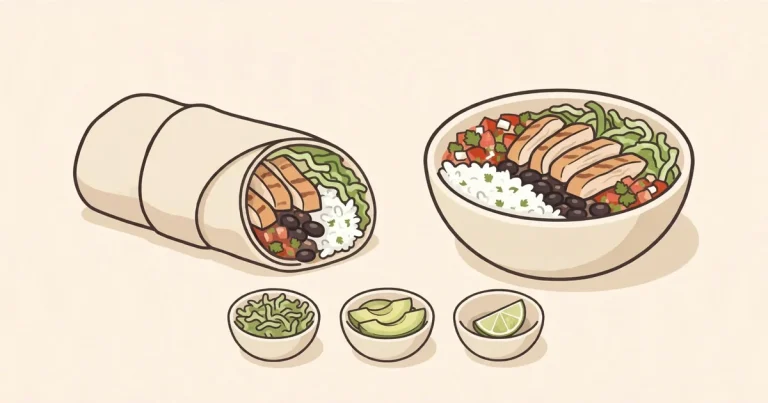
- Kid’s Build Your Own — no locked baseline. You choose the tortilla or shell, protein, rice, beans, one included side, one drink, and up to two toppings.
- Kid’s Quesadilla — starts with a locked 190-calorie baseline (kids quesadilla tortilla at 80 cal + Kids Cheese at 110 cal) before anything else is added.
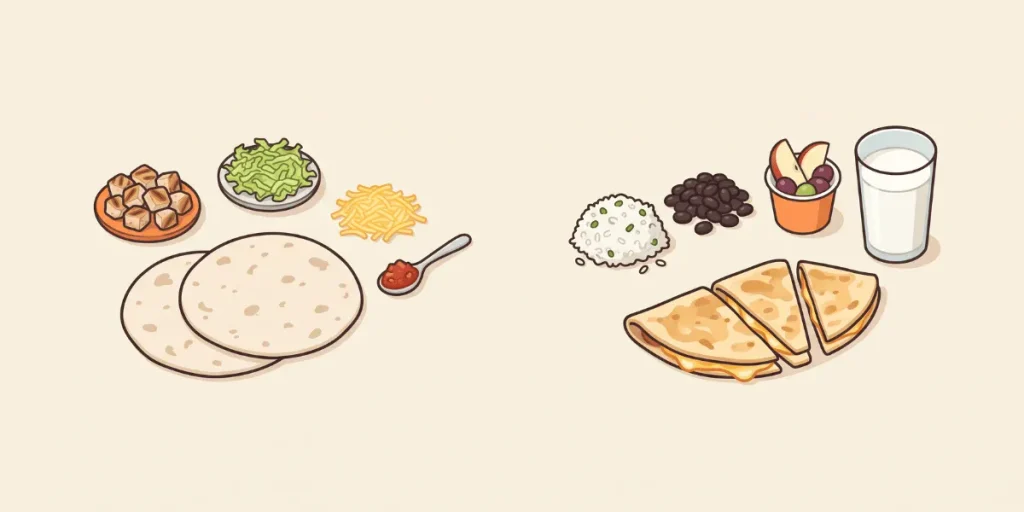
Held constant — same chicken, brown rice, black beans, blueberries, and milk — the published comparison comes out:
| Example | Calories | Protein | Carbs | Fat | Sodium |
|---|---|---|---|---|---|
| Build Your Own (2 flour taco tortillas) | 600 | 37 g | 78 g | 15 g | 850 mg |
| Kid’s Quesadilla (fixed tortilla + cheese) | 620 | 40 g | 65 g | 21 g | 880 mg |
Twenty calories apart — but different meals underneath: the quesadilla build carries more protein, fewer carbs, and more fat. Asking which starter is “better” is the wrong question; they’re different macro profiles, and the rest of the order decides more than the starter does.
Where the calories actually move: sides and drinks
This is the finding most parents would miss. The starter gap is 20 calories. The side gap:
| Included side | Calories |
|---|---|
| Blueberries | 20 |
| Mandarins | 35 |
| Kids Chips | 140 |
And drinks:
| Drink | Calories |
|---|---|
| Organic Apple Juice (6.75 oz) | 100 |
| Organic Milk (8 oz) | 110 |
| Organic Chocolate Milk (8 oz) | 160 |
Swapping blueberries for kids chips changes the meal by 120 calories — six times the starter gap. The complete example build (Build Your Own with chicken, brown rice, black beans, blueberries, and milk, no toppings) totals 600 calories and 37 g protein — and that total moves more on the side and drink choices than on anything about the starter format.
The honesty details
Three things worth knowing about how this data is maintained:
- Unavailable means unavailable. The limited-time Kids Pollo Asado lists 90 calories with its other macros marked unavailable — and a kids soda row is being held back entirely until its macros pass QA. Neither is estimated.
- No invented kids bowl. Some searches ask for a kids meal bowl, but no official Kids Bowl starter exists — so the calculator doesn’t invent one to match the search phrase.
- Estimates, not measurements. Restaurant portions vary; these are consistent applications of official serving values, not a measurement of the tray in front of you. For allergies or medical needs, check Chipotle’s official allergen information directly.
Where these numbers come from
Every figure above comes from this site’s independently maintained nutrition dataset — 34 active kids entries, built from Chipotle’s official U.S. nutrition publications (March 2025 PDF, August 2026 review, September 2026 sync; the August review added or corrected several kids-specific rows). Full sourcing and methods: Methodology & Data Sources.
Model the exact order: Chipotle Kids Meal Calculator